Coffee, tea & agro-processing
Distributed processing sites need stable power, controlled drying and dependable steam close to agricultural production areas.
Solar PV, tea machinery, biomass boilers, steam controls and process water
Kampala-supported EPC capability for Uganda’s beverage, tea, food and manufacturing sectors, combining reliable utilities with practical energy and water efficiency.
Commercial solar and industrial utility solutions for factories in Uganda
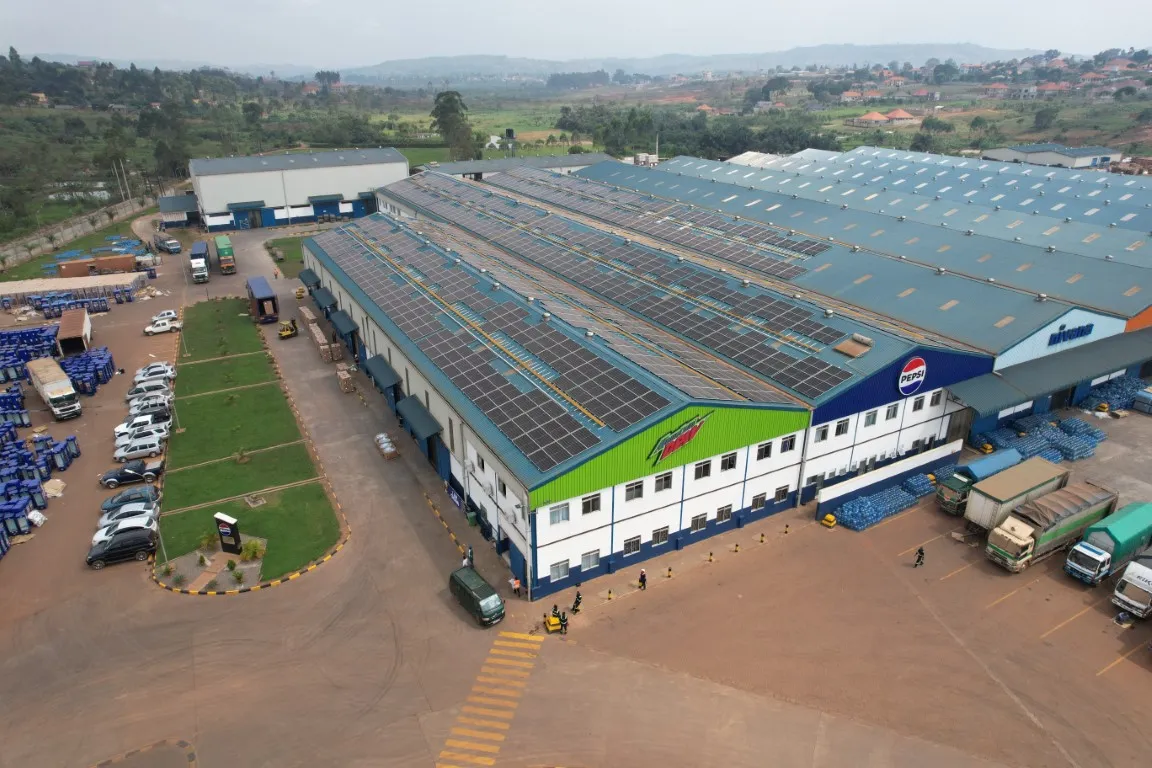
From its Kampala office, Spenomatic Uganda Ltd helps industrial customers build reliable, efficient energy and environmental infrastructure. Spenomatic's Ugandan work includes commercial and industrial solar PV for beverage manufacturing and tea processing.
Spenomatic’s contact in Uganda: Spenomatic Uganda Ltd, 4th Floor, Studio House, Bugolobi, Kampala, Uganda.
Spenomatic connects local operating conditions with measurable plant requirements before recommending equipment.
Country-specific operating needs shape which combination of solar, thermal, water and process engineering creates the strongest value.
Distributed processing sites need stable power, controlled drying and dependable steam close to agricultural production areas.
Solar PV, tea machinery, biomass boilers, steam controls and process waterProduct quality depends on hygienic water, reliable refrigeration, repeatable heating and well-managed effluent.
Water treatment, chillers, boilers, solar PV and wastewater treatmentSeasonal throughput and biomass availability create opportunities for integrated thermal and electrical utility planning.
Fuel-flexible boilers, biomass handling, solar, laboratories and O&MCement, steel and other energy-intensive facilities benefit from load profiling, efficient auxiliaries and resilient on-site generation.
C&I solar, power studies, water reuse and preventive maintenanceImages from Spenomatic’s wider project portfolio illustrate applicable technologies. They are not presented as projects delivered in this country unless explicitly identified.
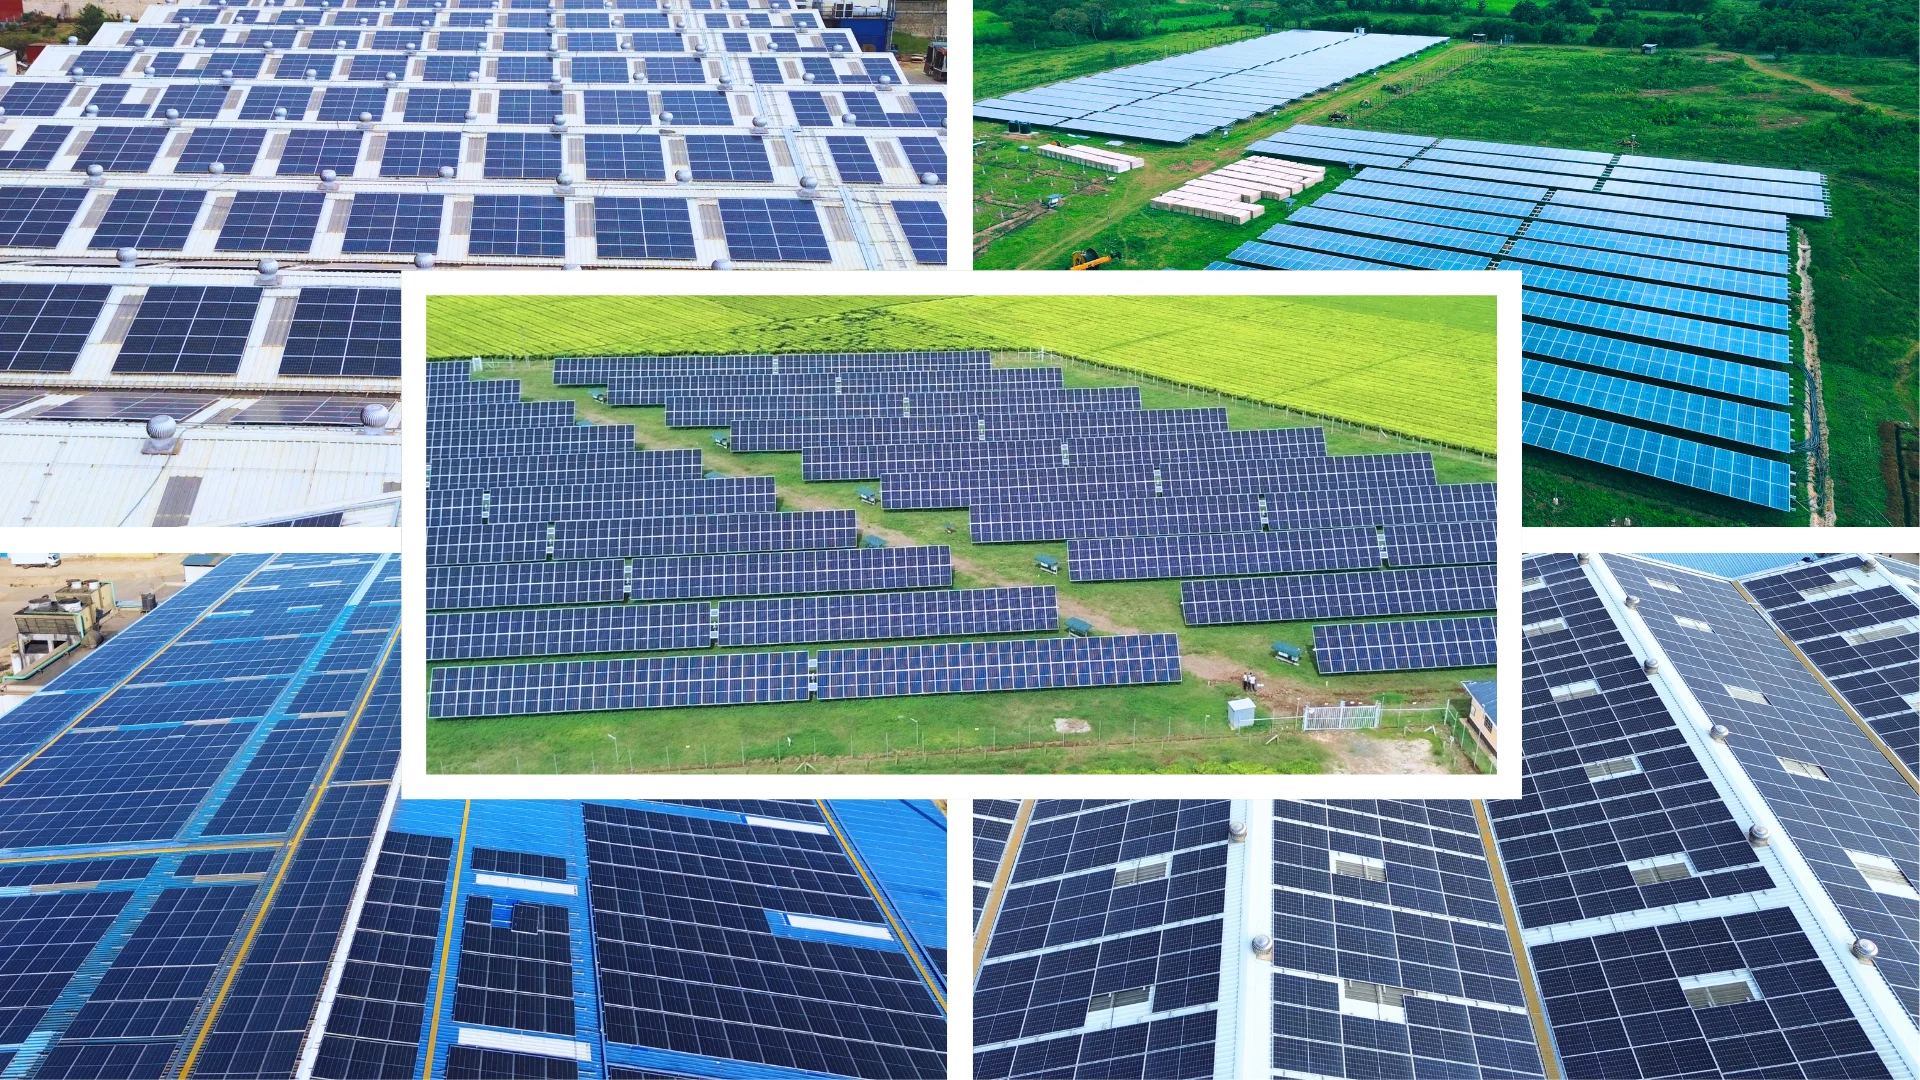
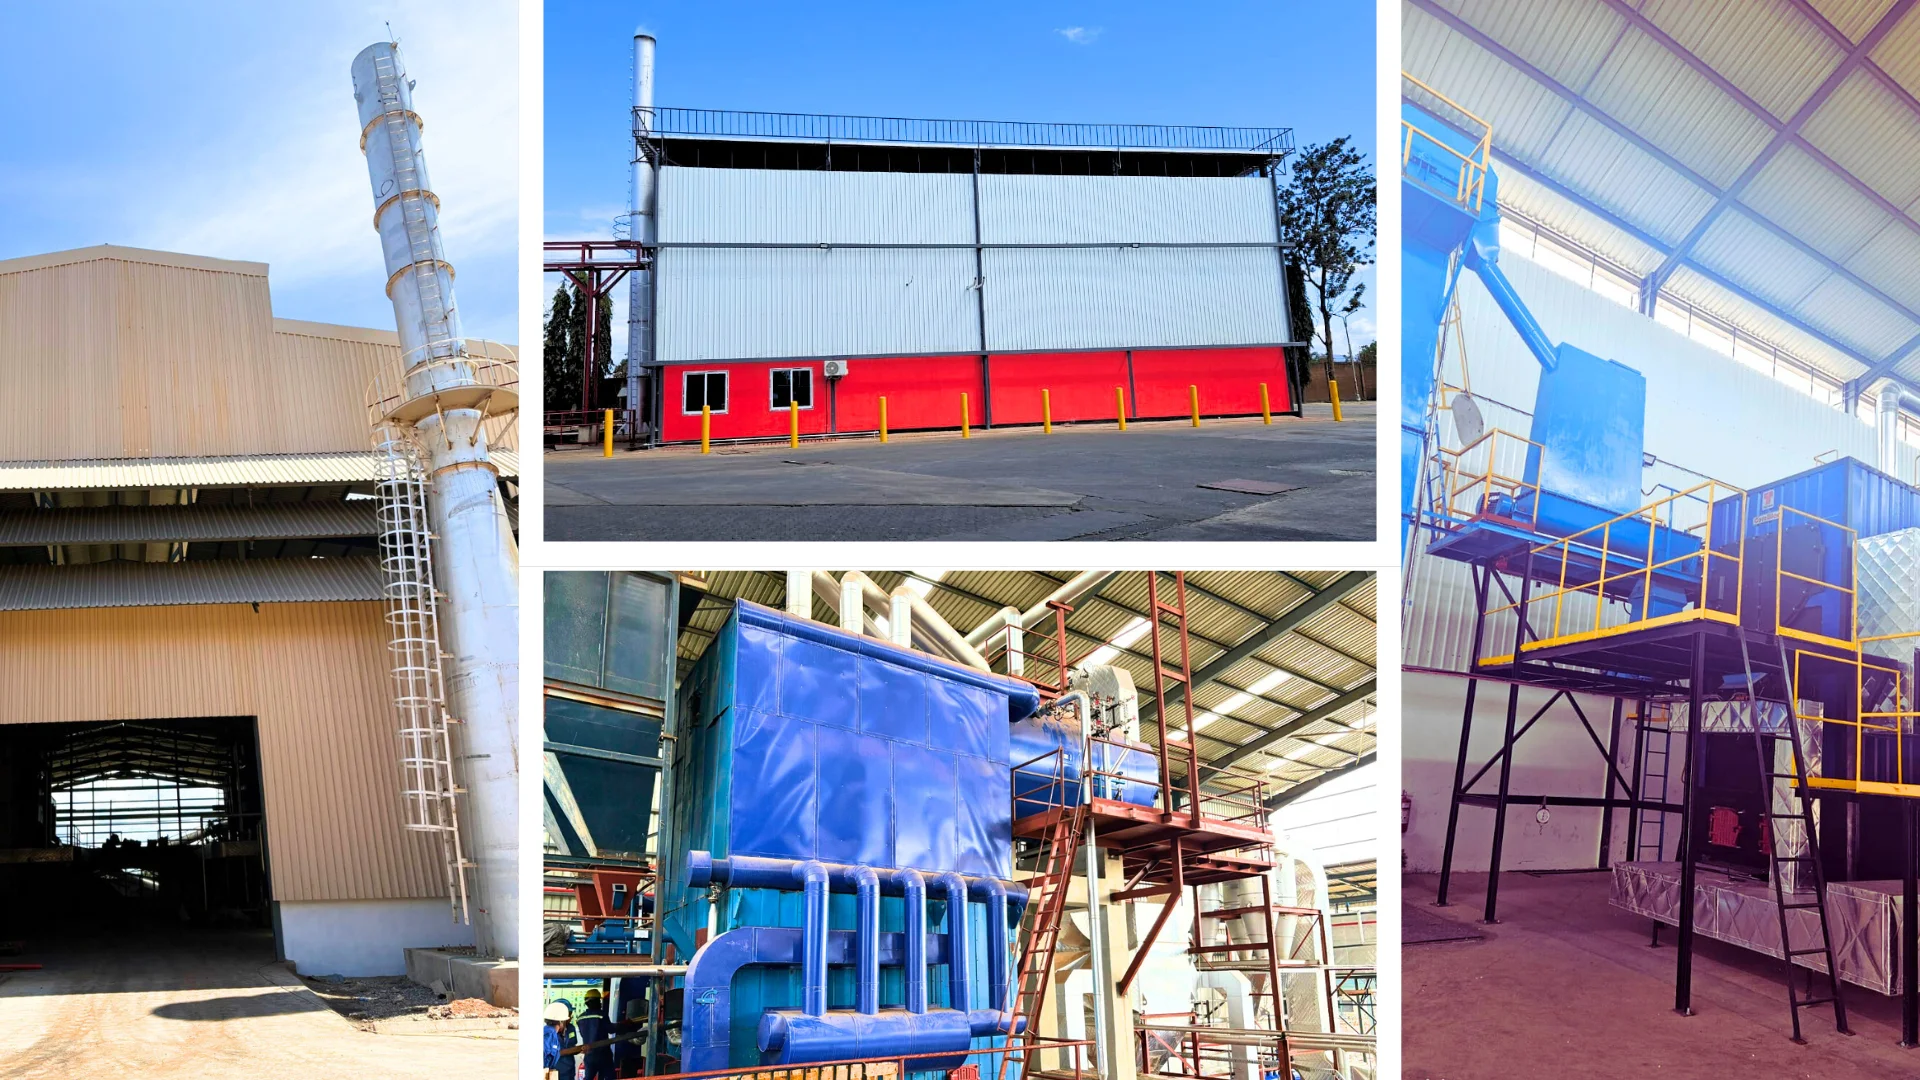
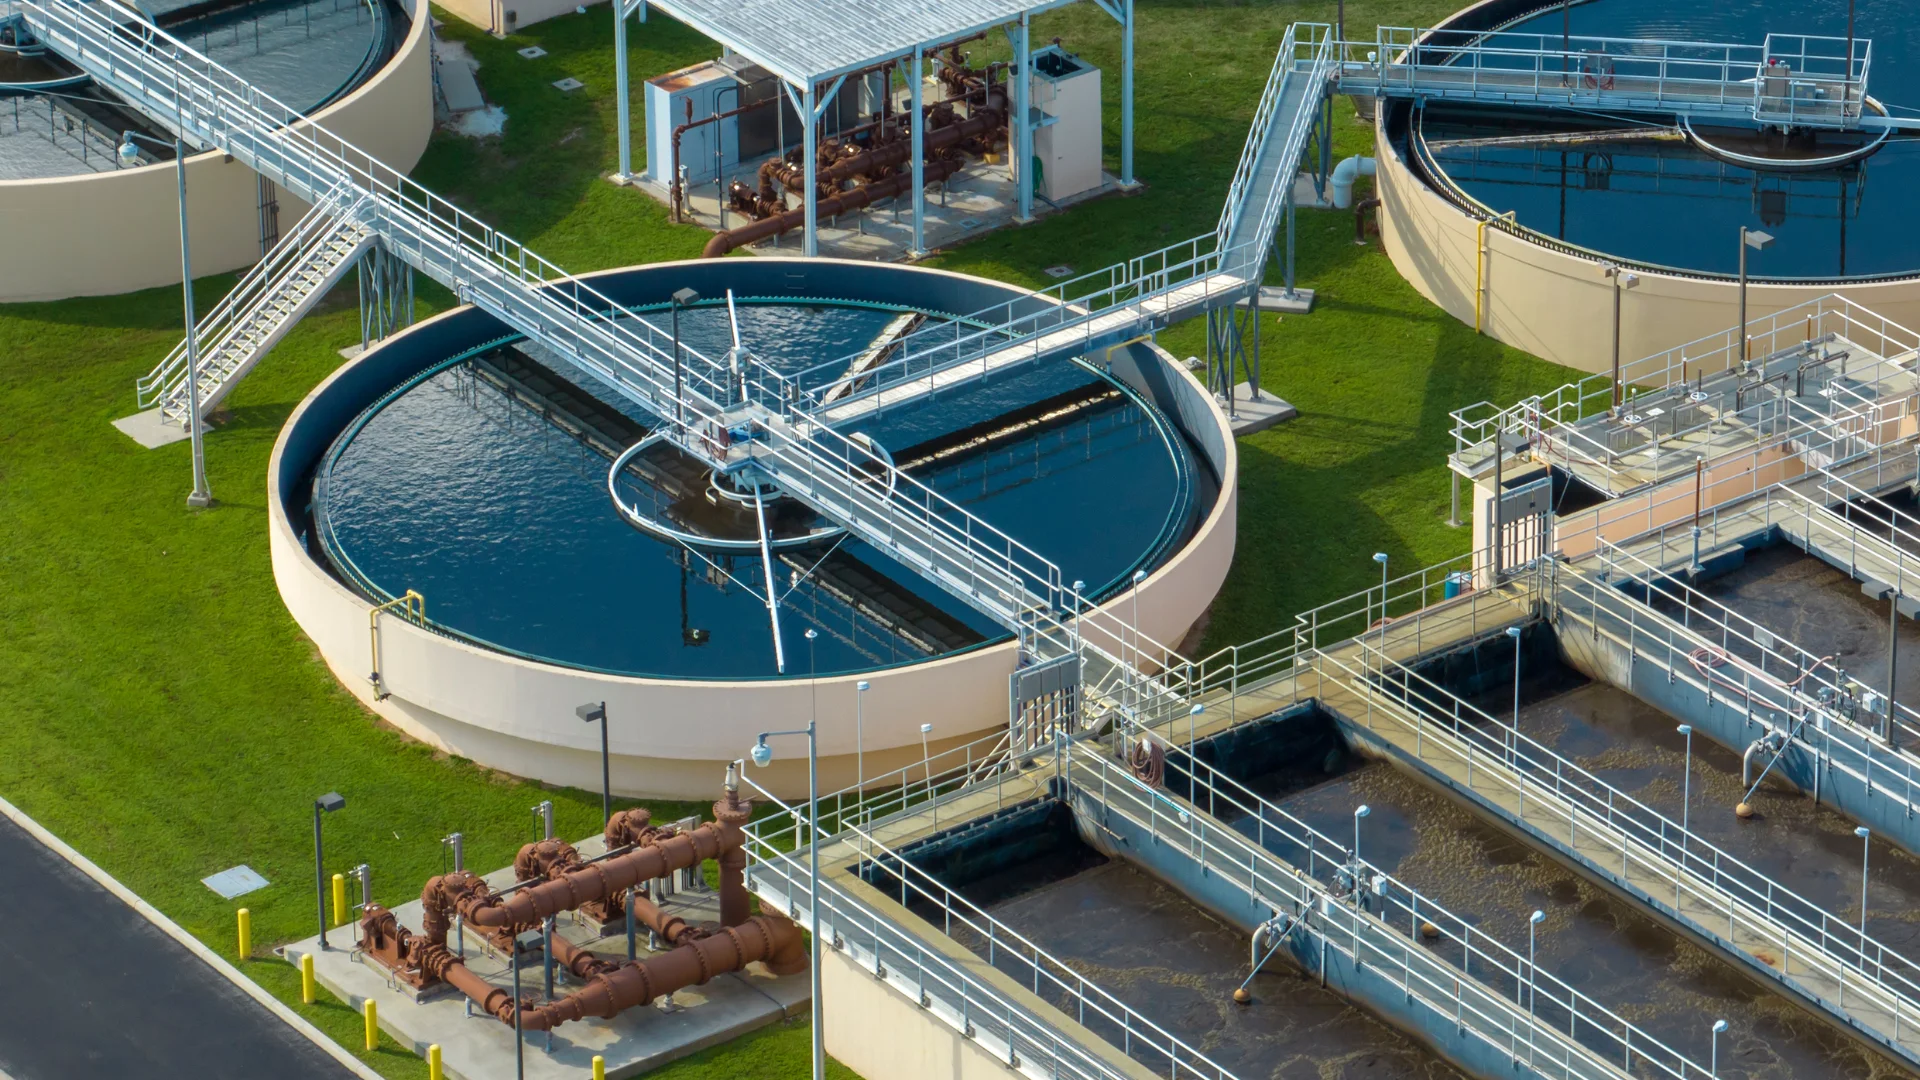
Uganda’s beverage, tea and wider agro-processing industries benefit from utilities that remain reliable beyond the grid, manage energy cost and support expansion close to agricultural production areas.
Build on Spenomatic’s beverage and tea installations with on-site solar that reduces daytime grid demand and supports more predictable production costs.
Explore Commercial & Industrial Solar PV →Provide stable process heat for beverage, food and agro-processing plants while using appropriate local biomass fuels and efficient combustion technology.
Explore Steam Boilers & Biomass Systems →Protect beverage and food quality with reliable process water, wastewater treatment and reuse systems designed for growing production volumes.
Explore Water & Effluent Treatment →Keep process temperatures consistent and reduce wasted steam in breweries, beverage lines, tea factories and food plants through better distribution and condensate return.
Explore Steam Systems & Accessories →Improve continuity for homes, offices and regional businesses with solar and battery systems that reduce disruption from grid interruptions.
Explore Home & Small Commercial Solar →Enable dependable testing, water conditioning and production quality for laboratories, healthcare teams and agro-industrial processors.
Explore Laboratory & Process Chemicals →Support Uganda’s tea factories with efficient processing machinery, solar power and thermal systems that improve reliability from green leaf intake to finished tea.
Explore Tea Sector Solutions →These projects are explicitly linked to the country in Spenomatic’s verified project database. Uganda.
This project features a 1MWp solar power system for a beverage manufacturing facility in Uganda. The solar installation delivers clean, reliable, and cost-effective renewable energy to su...
Calculated from 1 MW of installed solar capacity × about 833 tCO2/MW/year, the rate implied by Spenomatic's published 2.4 MW Kenya tea project (2,000 ÷ 2.4). Actual savings depend on solar yield, displaced grid or generator power, curtailment and operating conditions; this is not an audited project result.
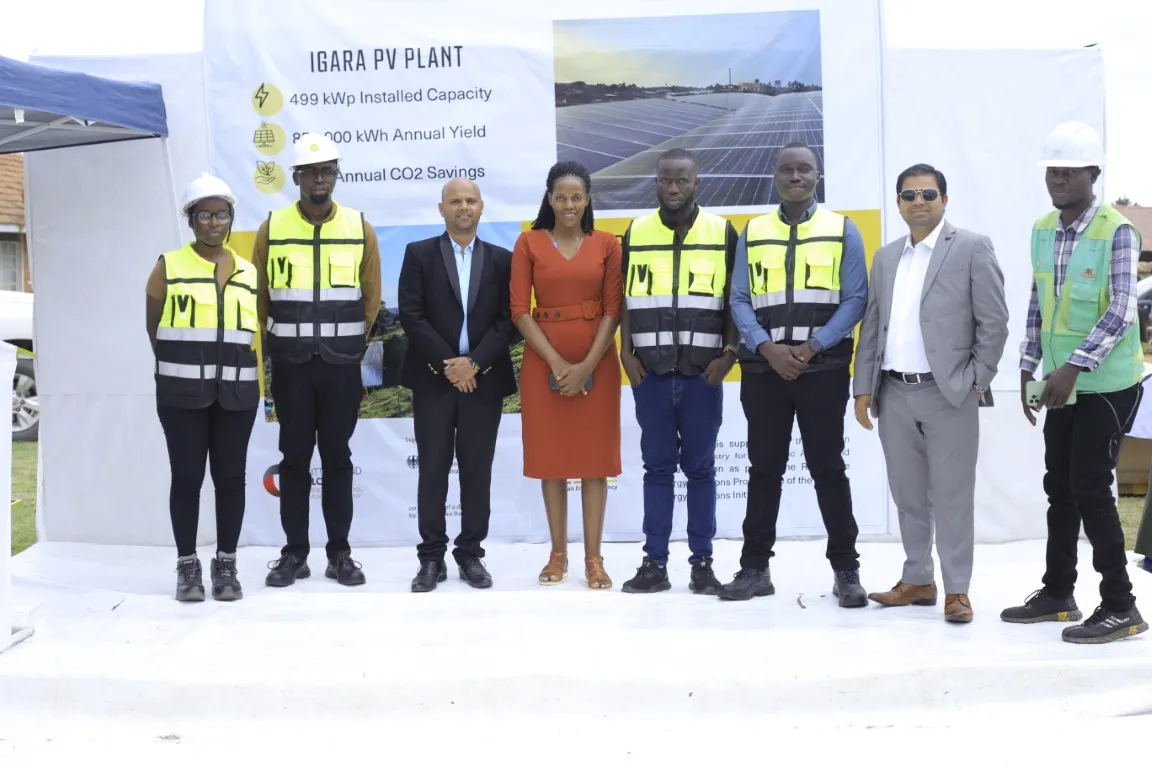
This project features a 500kWp Solar Power System for a Tea Processing Facility in Uganda. The system delivers reliable, clean, and cost-effective energy for large-scale industrial operat...
Calculated from 0.5 MW of installed solar capacity × about 833 tCO2/MW/year, the rate implied by Spenomatic's published 2.4 MW Kenya tea project (2,000 ÷ 2.4). Actual savings depend on solar yield, displaced grid or generator power, curtailment and operating conditions; this is not an audited project result.
Policy and environmental requirements change. These research notes strengthen early planning but do not replace project-specific legal, utility or environmental advice.
Spenomatic's two featured Ugandan solar installations provide 1.5 MWp of combined capacity, helping customers reduce reliance on grid electricity and fossil fuels while improving energy resilience. Applying the Kenya tea-project benchmark gives an indicative combined impact of about 1,250 tCO2 per year. Project cards show the calculation and distinguish estimates from measured results.
Evidence note: Indicative solar figures use about 833 tCO2/MW/year, derived from Spenomatic's published 2.4 MW Kenya tea project. Actual Uganda results require project generation and displaced-power data.
Spenomatic supports commercial solar PV, boiler and biomass systems, water and effluent treatment, steam distribution, tea machinery, laboratory systems and long-term maintenance from its Kampala presence.
Yes. The verified country portfolio on this page includes a 1 MWp solar installation for beverage manufacturing and a 500 kWp installation for a tea-processing facility in Ishaka.
Requirements depend on capacity, grid interaction, location and environmental effects. ERA and the electricity utility govern sector and connection requirements, while NEMA determines whether a Project Brief or ESIA route applies.
The utilities interact: solar can reduce daytime electrical demand, efficient steam protects heat-intensive production, and fit-for-purpose water treatment supports quality and discharge performance. Integrated design avoids shifting a bottleneck from one utility to another.
Design considers local rainfall intensity, humidity, lightning risk, site elevation, drainage, source-water variability and road access. Final specifications depend on a site survey and measured operating data.
Share your site location, load profile, steam demand, source-water data or production challenge. Spenomatic will help identify the right feasibility path.