Tea & agro-processing
Tea, coffee, grain and food processors need dependable heat, clean power and process water across highland and regional production sites.
Tea machinery, biomass boilers, rooftop solar, steam optimisation and water treatment
Kenya-based engineering for commercial solar, reliable steam, efficient water systems and productive industrial operations—from feasibility and design through commissioning and lifecycle support.
Solar EPC, industrial boilers and water treatment solutions for businesses in Kenya
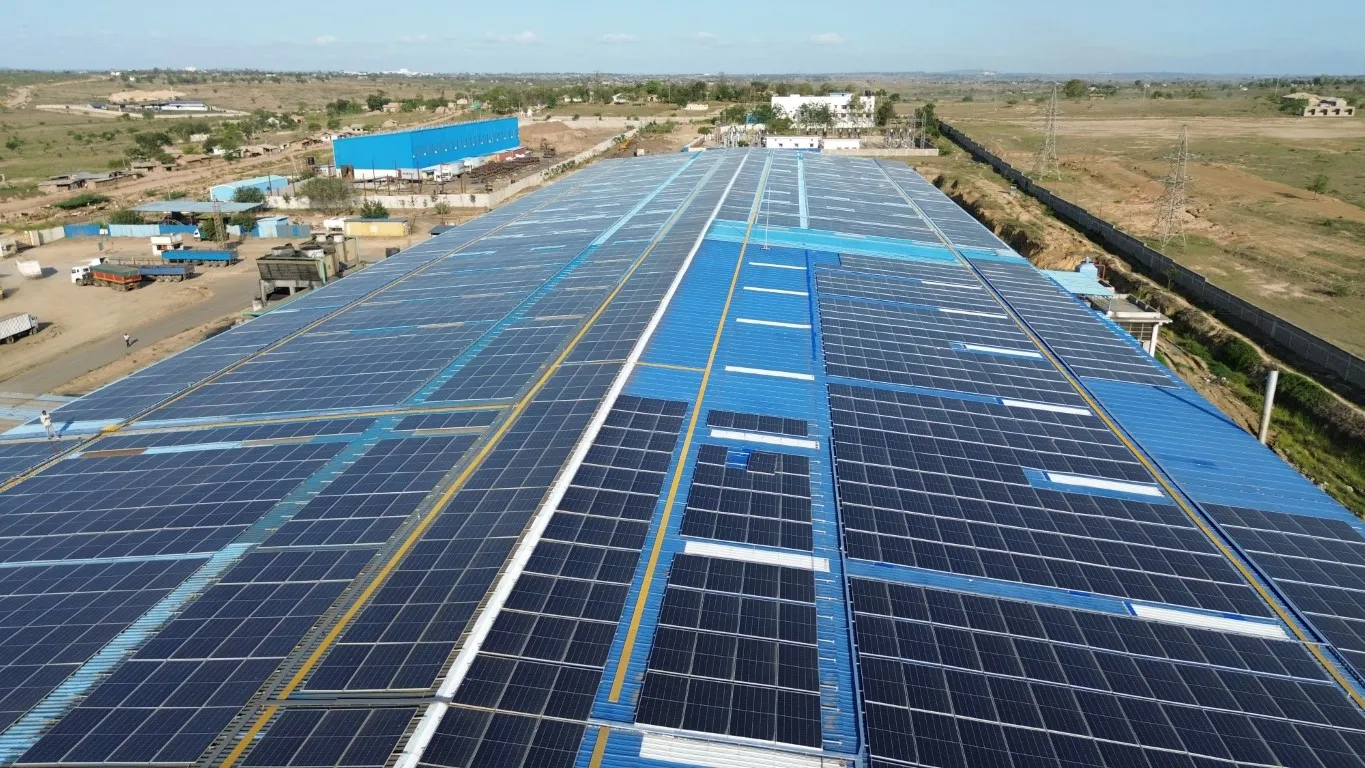
Founded in Kenya in 1998 and headquartered in Nairobi, Spenomatic helps industrial customers improve reliability, efficiency and sustainability through turnkey solar PV, steam and biomass systems, water and effluent treatment, steam accessories, tea-processing machinery, and laboratory and process chemicals.
Spenomatic’s contact in Kenya: Spenomatic Solar Ltd, 3rd Floor, Block B, Spring Valley Business Park, Nairobi, Kenya.
Spenomatic connects local operating conditions with measurable plant requirements before recommending equipment.
Country-specific operating needs shape which combination of solar, thermal, water and process engineering creates the strongest value.
Tea, coffee, grain and food processors need dependable heat, clean power and process water across highland and regional production sites.
Tea machinery, biomass boilers, rooftop solar, steam optimisation and water treatmentHygienic water, refrigeration continuity, stable steam and controlled energy costs support consistent production and food-safety performance.
Process water, effluent treatment, C&I solar, boilers, chillers and laboratory systemsSteel, plastics, rubber, timber and general manufacturers can reduce daytime demand while improving utility reliability and plant efficiency.
Large-scale solar PV, power-quality studies, steam accessories and preventive maintenanceHotels, hospitals, offices and institutions require resilient electricity, hot water and treatment systems with practical lifecycle support.
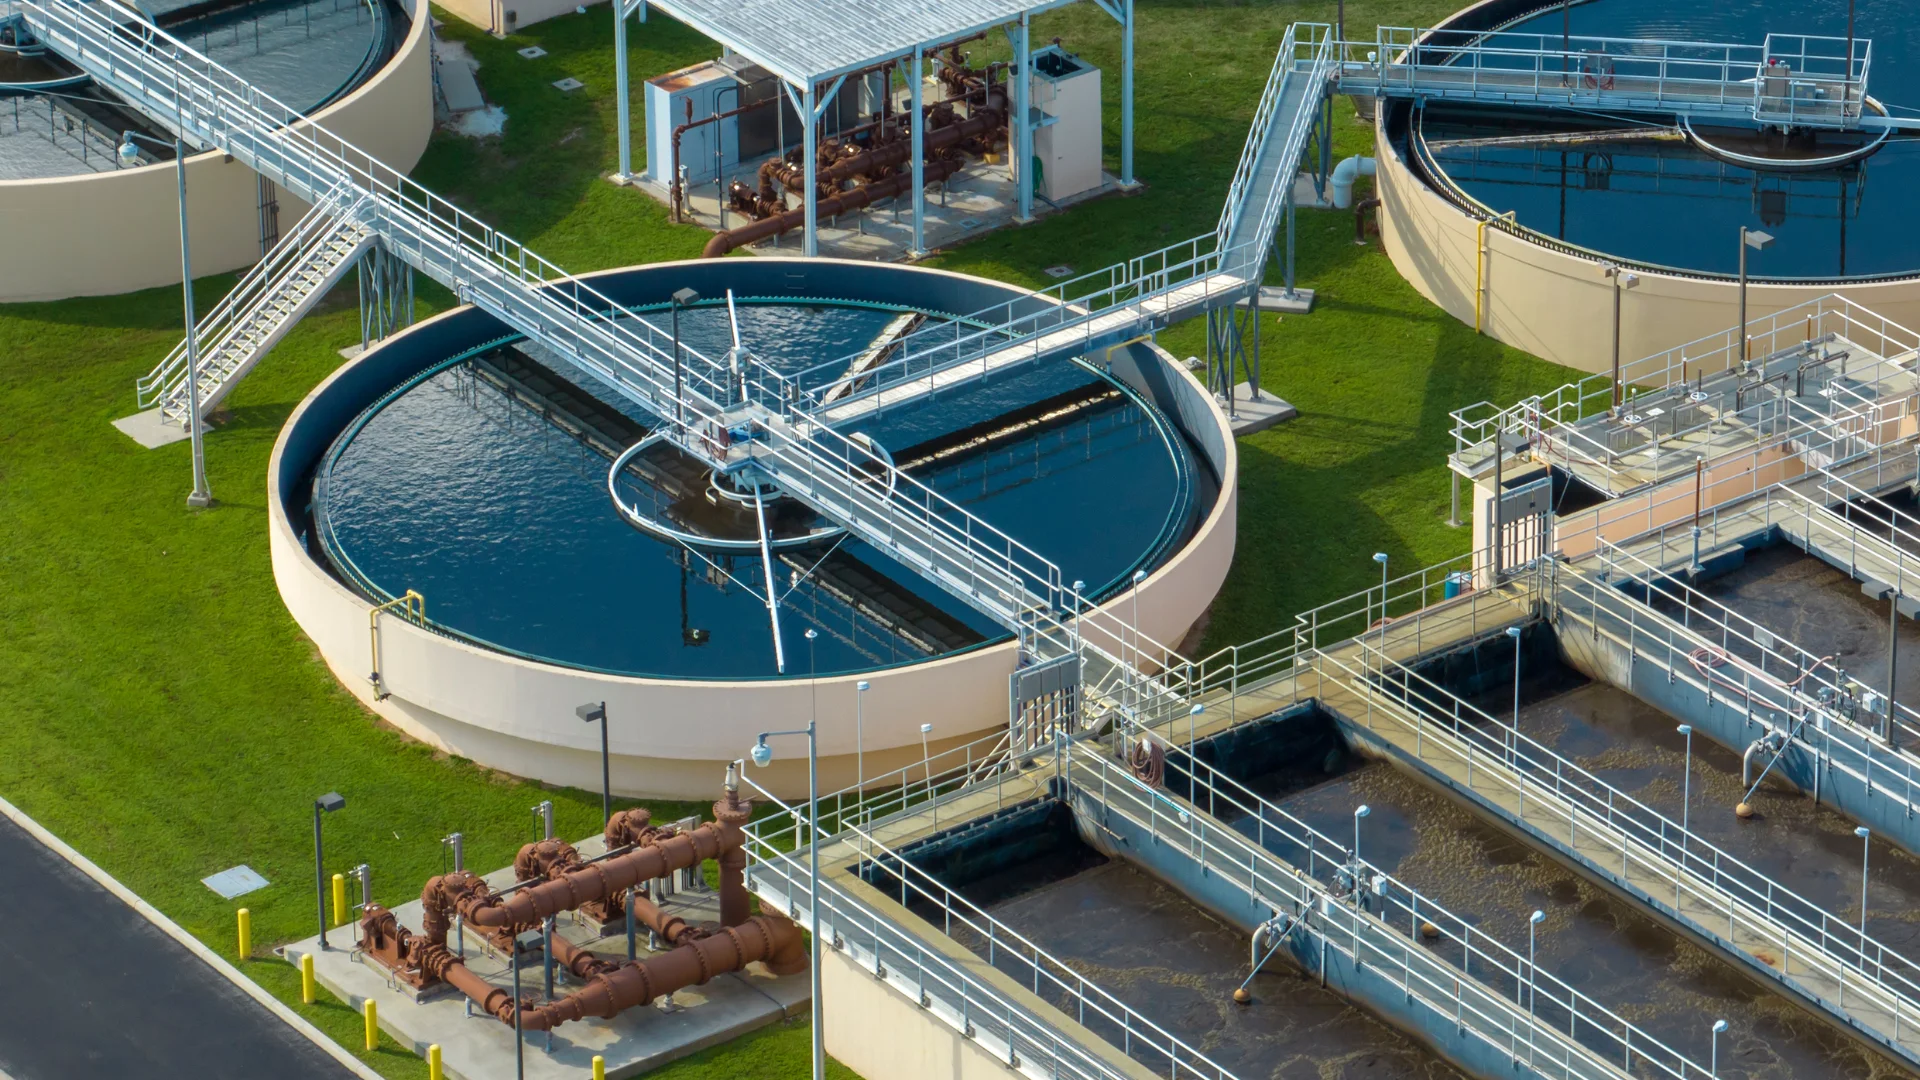
Solar and storage, hot-water systems, water treatment, laboratories and O&MImages from Spenomatic’s wider project portfolio illustrate applicable technologies. They are not presented as projects delivered in this country unless explicitly identified.
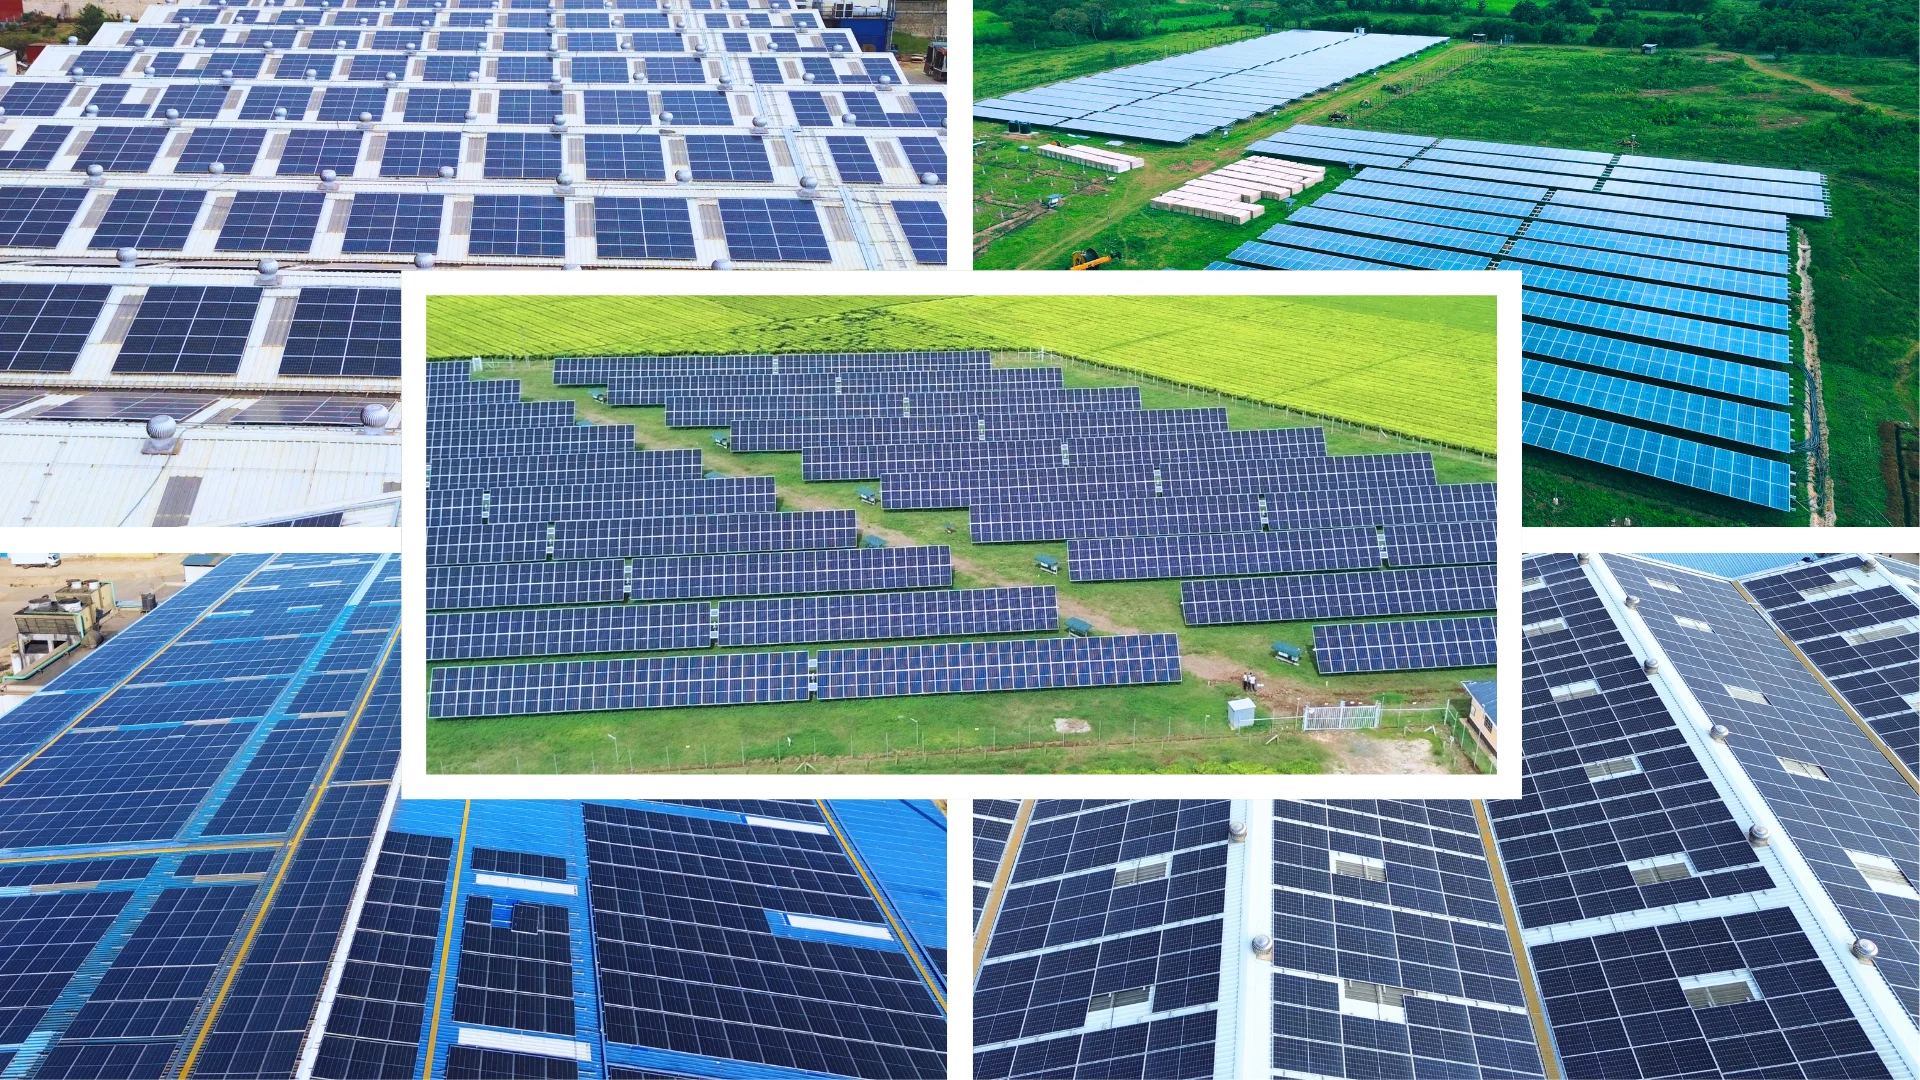
Kenya’s diverse manufacturing and agro-processing base needs dependable utilities that control production costs, strengthen resilience and make better use of local renewable resources. Spenomatic combines these services into practical, plant-wide solutions.
Reduce daytime electricity costs and grid exposure for Kenya’s steel, food, plastics, timber, aviation and tea operations through rooftop, ground-mounted and hybrid solar systems.
Explore Commercial & Industrial Solar PV →Turn locally available biomass into dependable process heat for tea, food and other steam-intensive plants while improving fuel flexibility and boiler efficiency.
Explore Steam Boilers & Biomass Systems →Help water-intensive manufacturers protect product quality, recover water and meet discharge requirements as freshwater availability and treatment costs become more important.
Explore Water & Effluent Treatment →Improve steam quality and reduce distribution losses across established Kenyan factories through correctly sized valves, traps, controls and condensate-recovery systems.
Explore Steam Systems & Accessories →Give homes, offices, workshops and growing businesses reliable power through right-sized solar, battery and hybrid systems designed around daily loads.
Explore Home & Small Commercial Solar →Support consistent quality, safe water and dependable process control for Kenyan laboratories, healthcare facilities, tanneries and manufacturers.
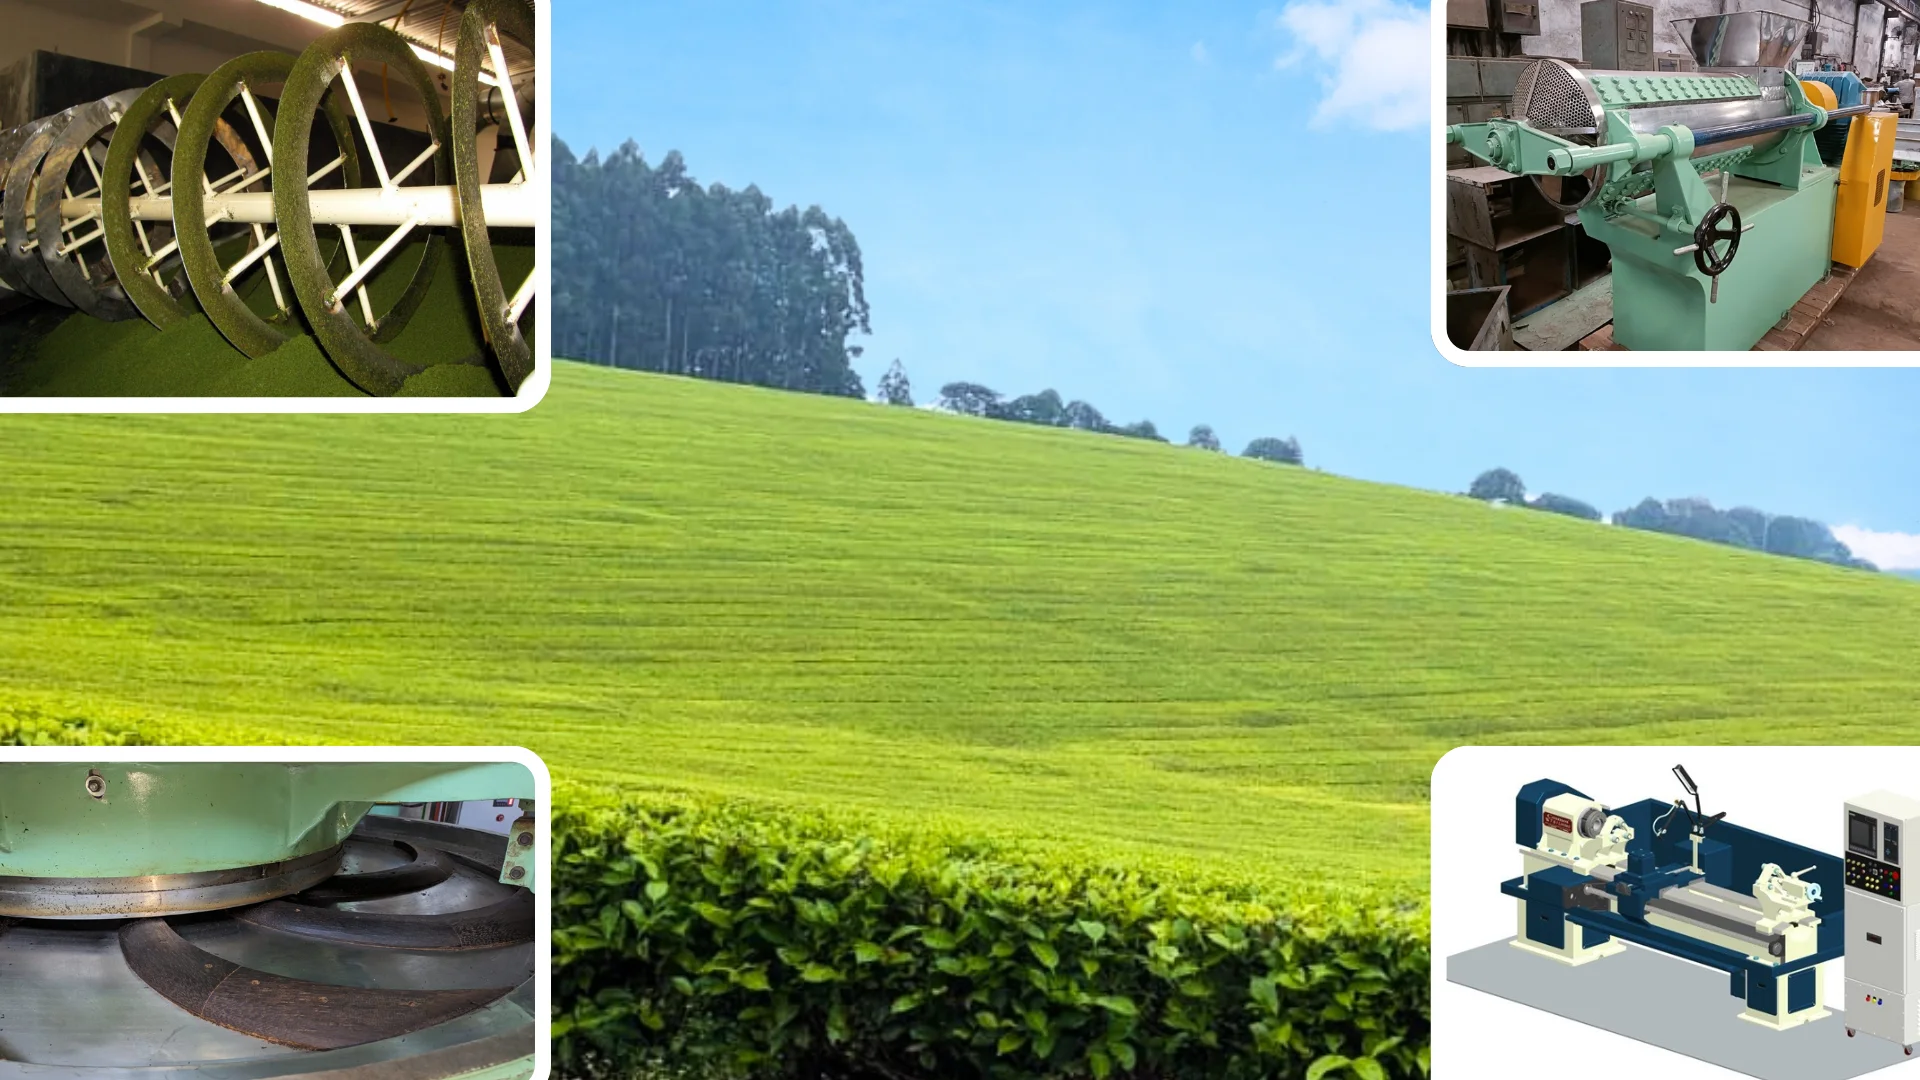
Explore Laboratory & Process Chemicals →Strengthen one of Kenya’s leading value chains with integrated tea machinery, renewable power, efficient steam and utility systems that protect throughput and cup quality.
Explore Tea Sector Solutions →These projects are explicitly linked to the country in Spenomatic’s verified project database. Kenya.
This large-scale project delivers a 17.2MWp solar power system for steel manufacturing facilities across two major industrial sites in Kisumu and Mombasa, Kenya. The installations are des...
Calculated from 17.2 MW of installed solar capacity × about 833 tCO2/MW/year, the rate implied by Spenomatic's published 2.4 MW Kenya tea project (2,000 ÷ 2.4). Actual savings depend on solar yield, displaced grid or generator power, curtailment and operating conditions; this is not an audited project result.
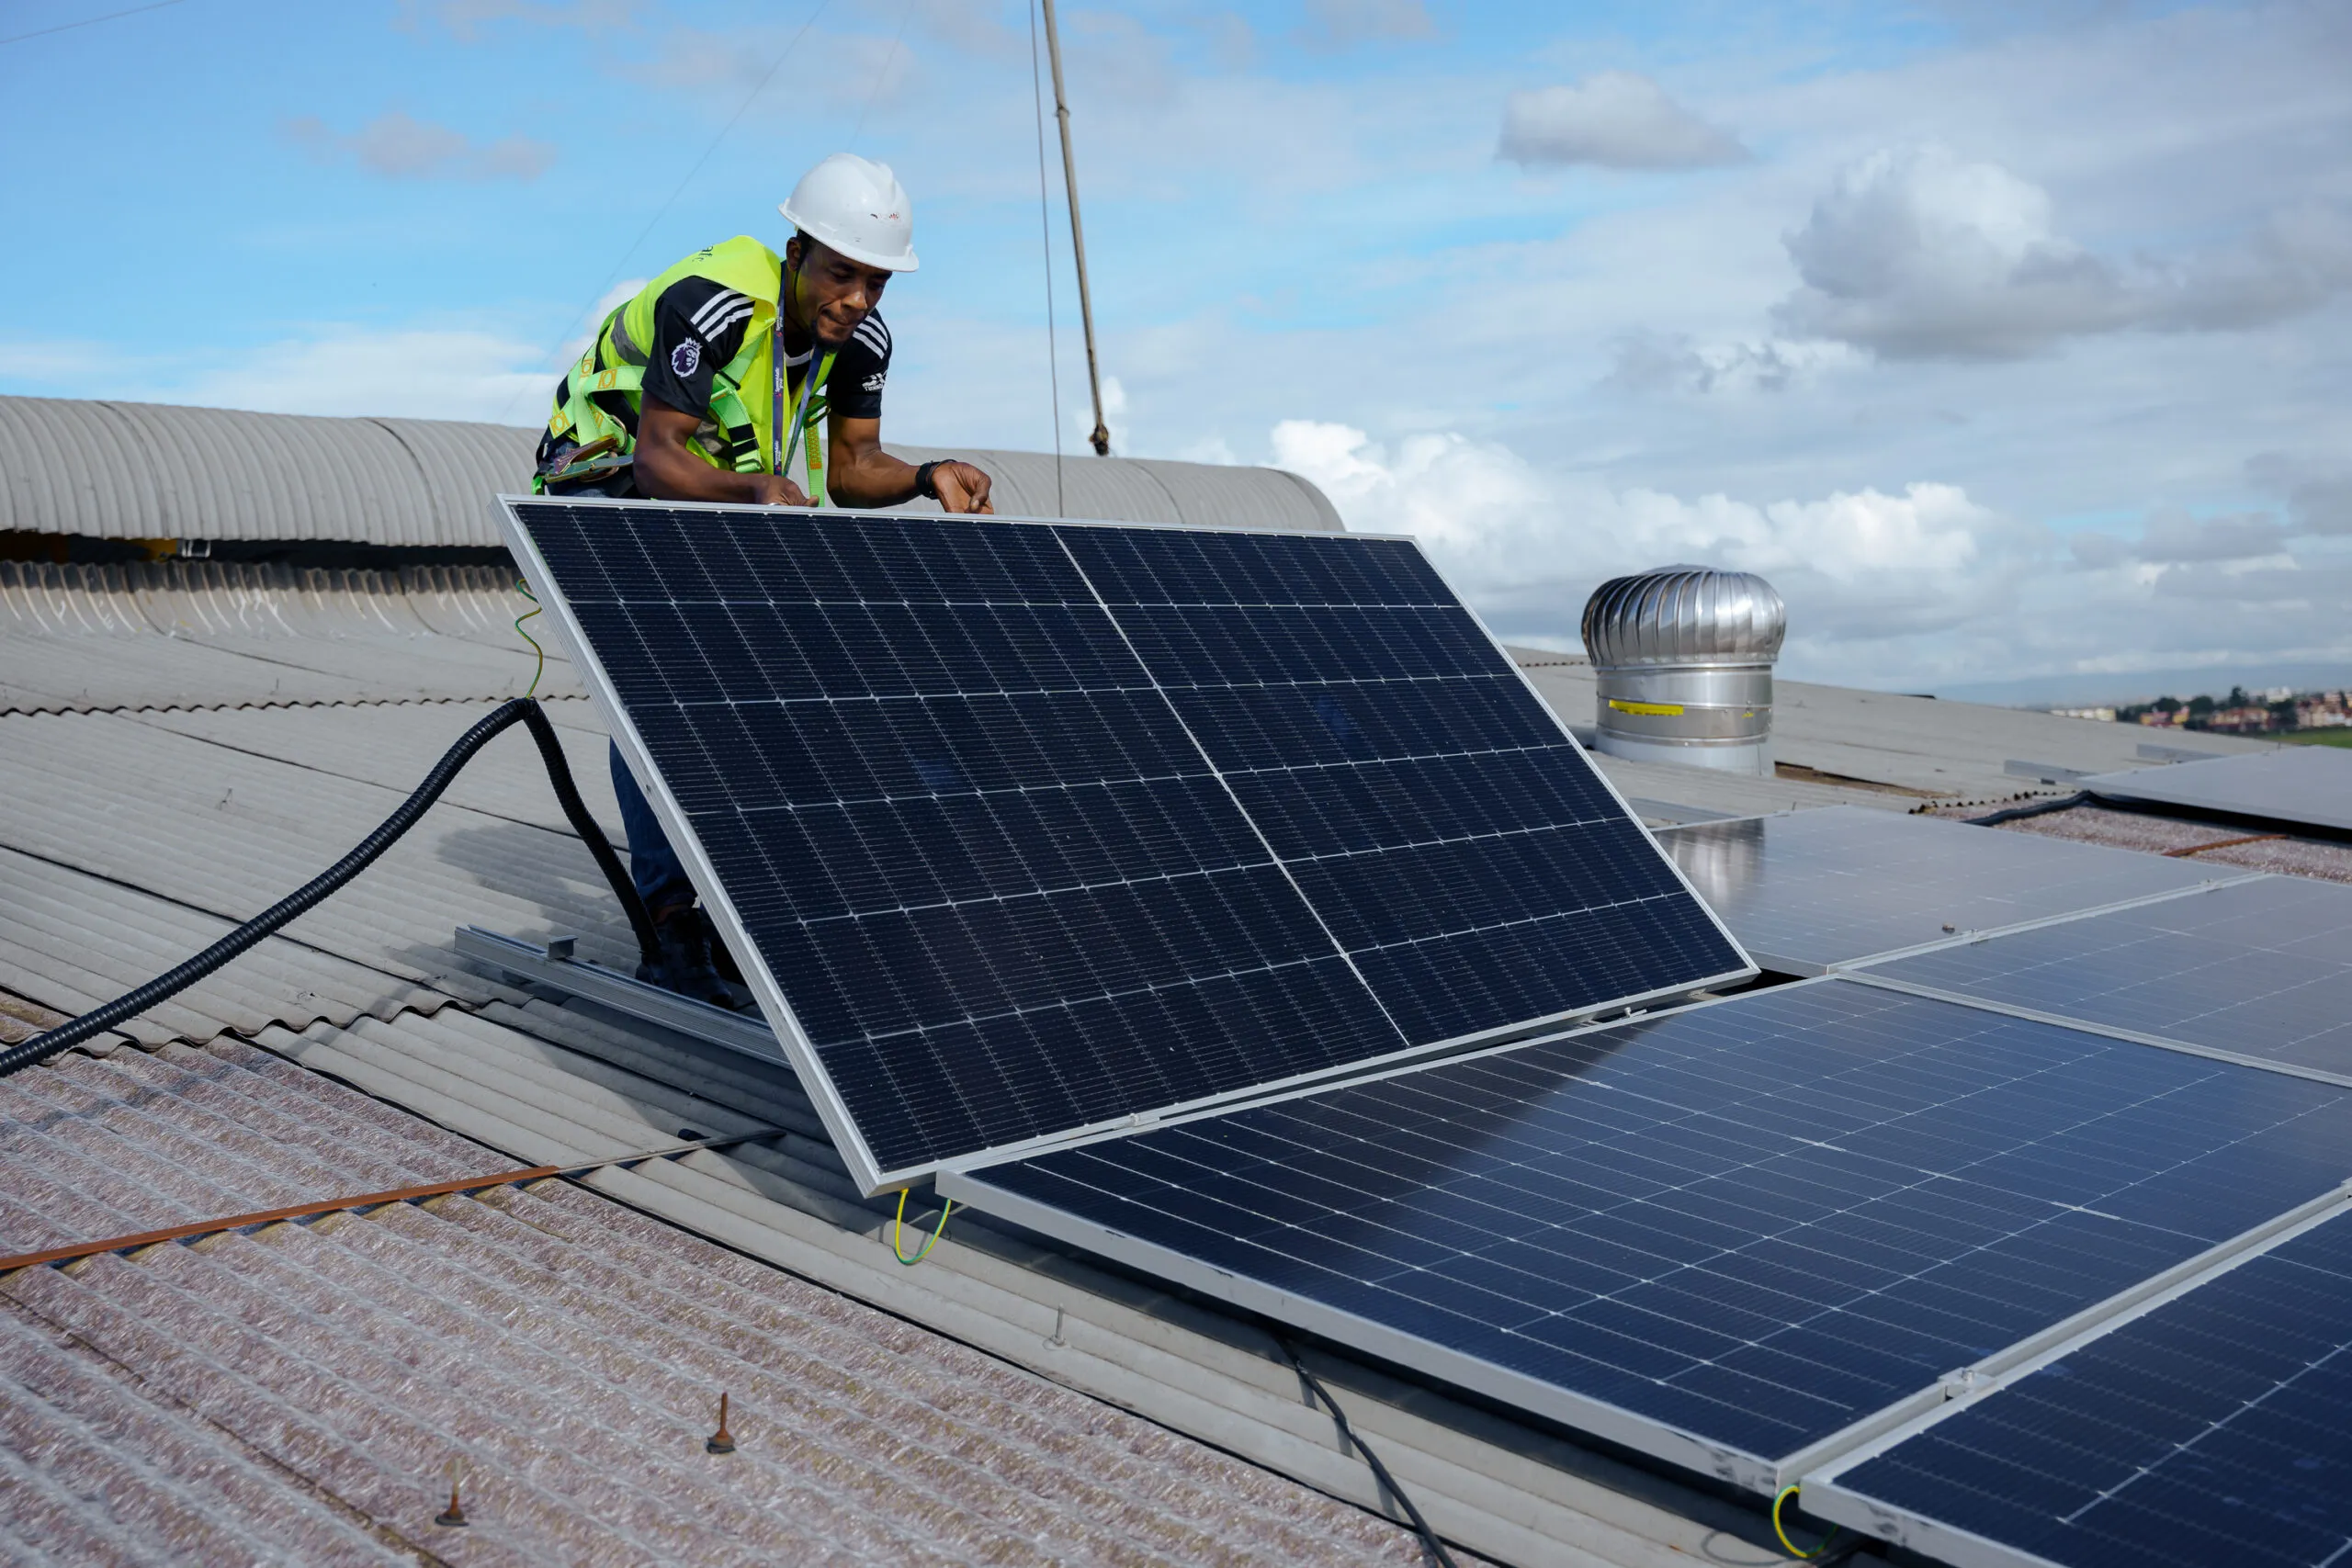
At Spenomatic, we are committed to delivering sustainable solar energy solutions for tea processing and manufacturing that improve efficiency, reduce operating costs, and minimize environ...
The project case study reports more than 5 GWh of clean electricity and an estimated 2,000 tonnes of CO2 emissions avoided each year.
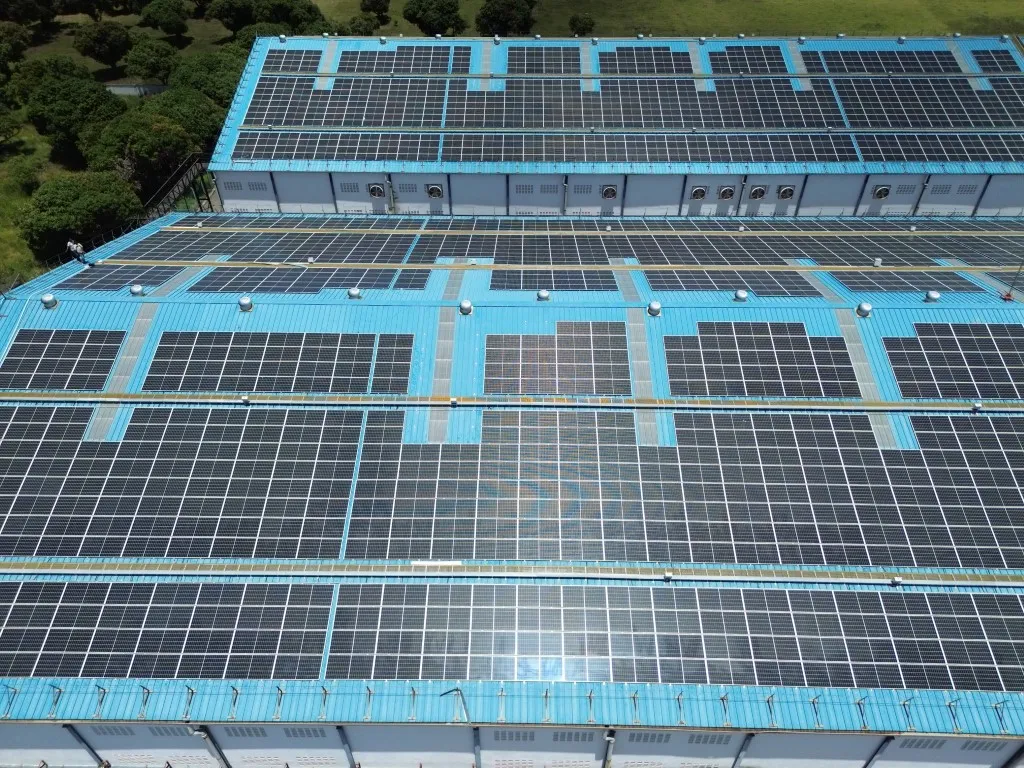
This project features a 2.2MWp roof-mounted solar power system for a footwear manufacturing company in Mombasa, Kenya. The installation is designed to maximize the use of available roofto...
Calculated from 2.2 MW of installed solar capacity × about 833 tCO2/MW/year, the rate implied by Spenomatic's published 2.4 MW Kenya tea project (2,000 ÷ 2.4). Actual savings depend on solar yield, displaced grid or generator power, curtailment and operating conditions; this is not an audited project result.
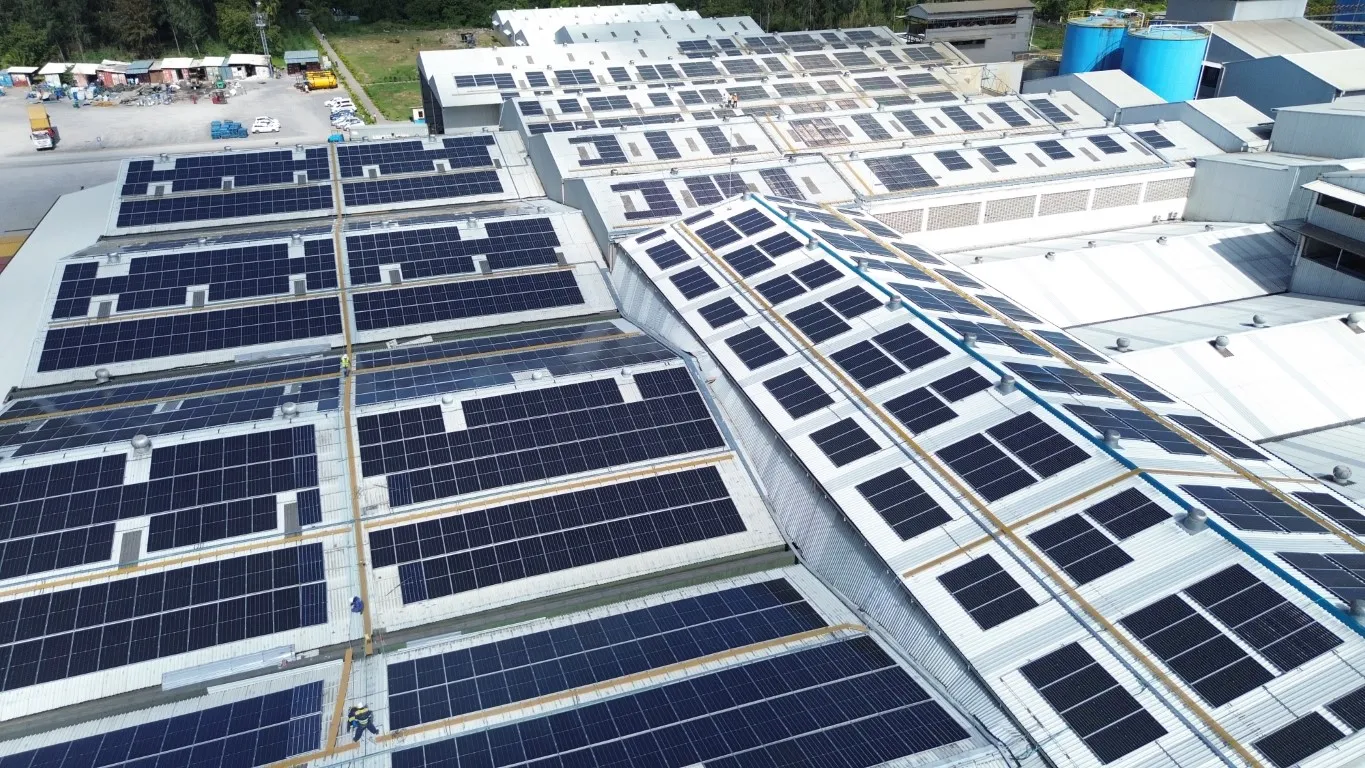
This project involved the design and installation of a 1.5MWp roof-mounted solar power system for a food manufacturing facility in Mombasa, Kenya. The system was carefully engineered to m...
Calculated from 1.5 MW of installed solar capacity × about 833 tCO2/MW/year, the rate implied by Spenomatic's published 2.4 MW Kenya tea project (2,000 ÷ 2.4). Actual savings depend on solar yield, displaced grid or generator power, curtailment and operating conditions; this is not an audited project result.
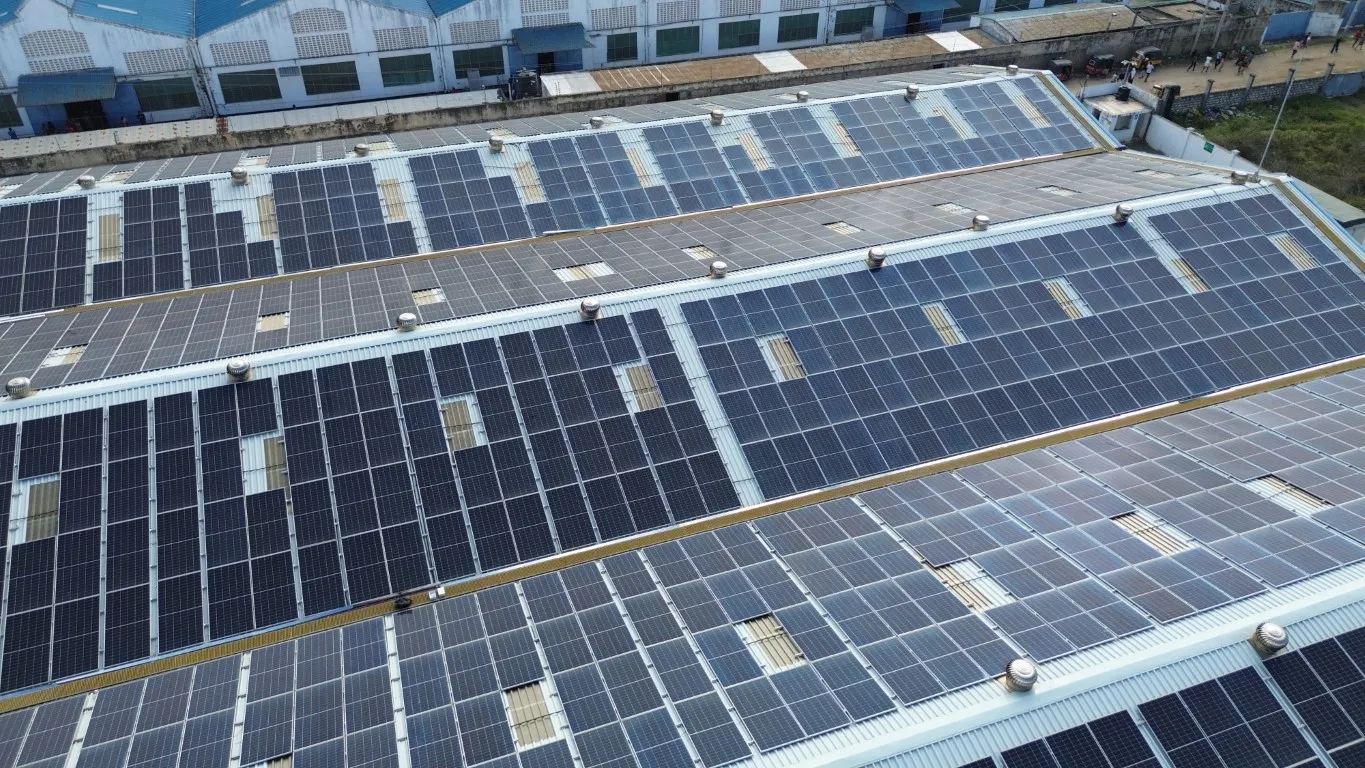
This project features a 1.4MWp roof-mounted solar power system for an engineering and manufacturing company in Mombasa, Kenya. The installation is designed to make efficient use of availa...
Calculated from 1.4 MW of installed solar capacity × about 833 tCO2/MW/year, the rate implied by Spenomatic's published 2.4 MW Kenya tea project (2,000 ÷ 2.4). Actual savings depend on solar yield, displaced grid or generator power, curtailment and operating conditions; this is not an audited project result.
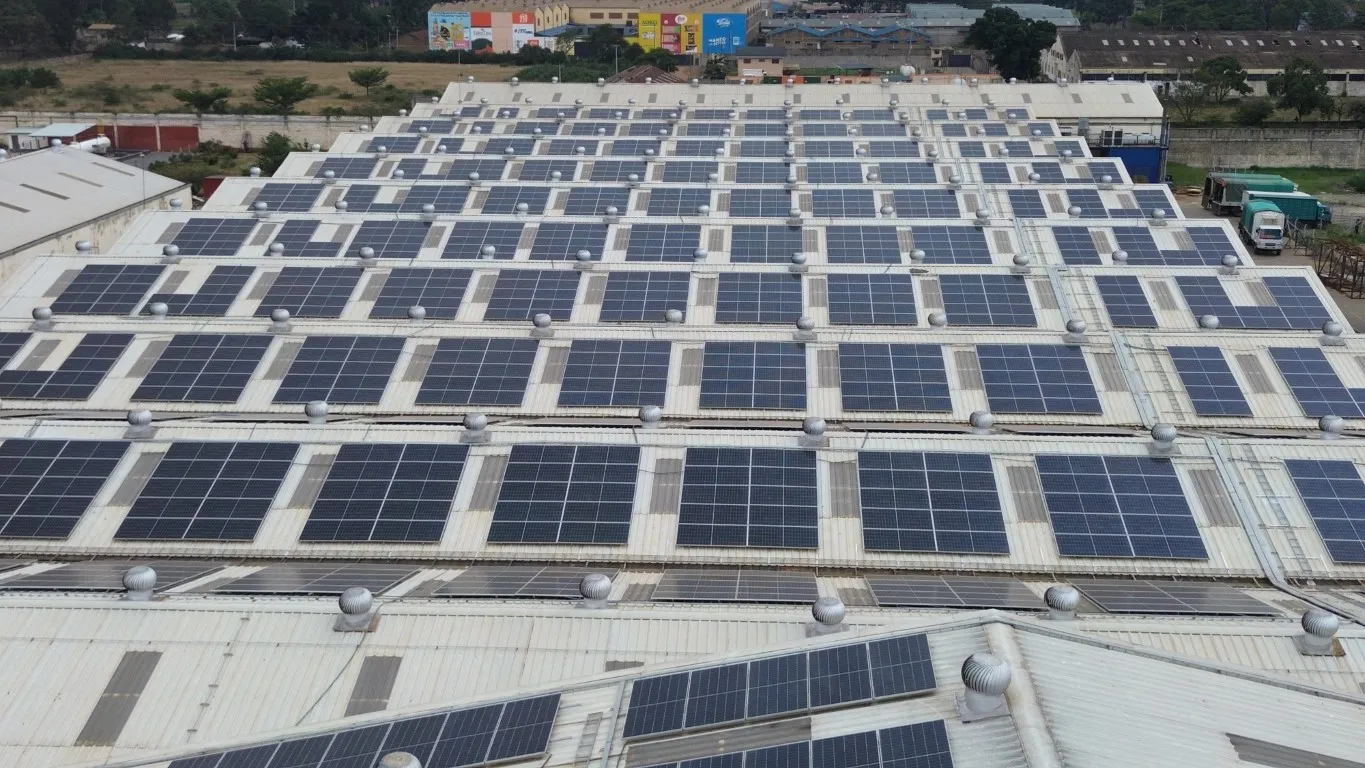
This project features a 1.25MWp roof-mounted solar power system for a food processing and milling company in Thika, Kenya. The installation is designed to make maximum use of available ro...
Calculated from 1.25 MW of installed solar capacity × about 833 tCO2/MW/year, the rate implied by Spenomatic's published 2.4 MW Kenya tea project (2,000 ÷ 2.4). Actual savings depend on solar yield, displaced grid or generator power, curtailment and operating conditions; this is not an audited project result.
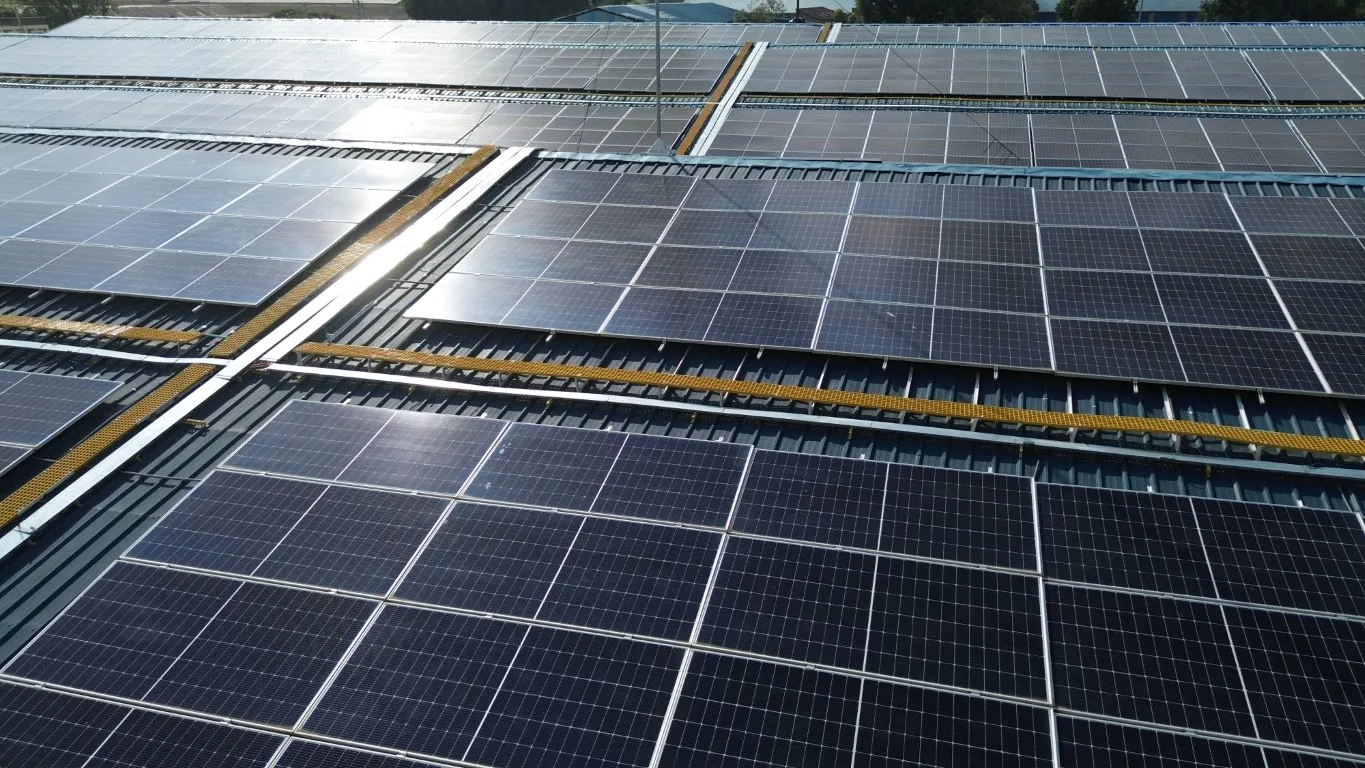
This project features a 1.5MWp solar power system for a sawmilling company installed in Njoro, Kenya. The system provides clean, reliable, and cost-effective energy to support daily sawmi...
Calculated from 1.5 MW of installed solar capacity × about 833 tCO2/MW/year, the rate implied by Spenomatic's published 2.4 MW Kenya tea project (2,000 ÷ 2.4). Actual savings depend on solar yield, displaced grid or generator power, curtailment and operating conditions; this is not an audited project result.
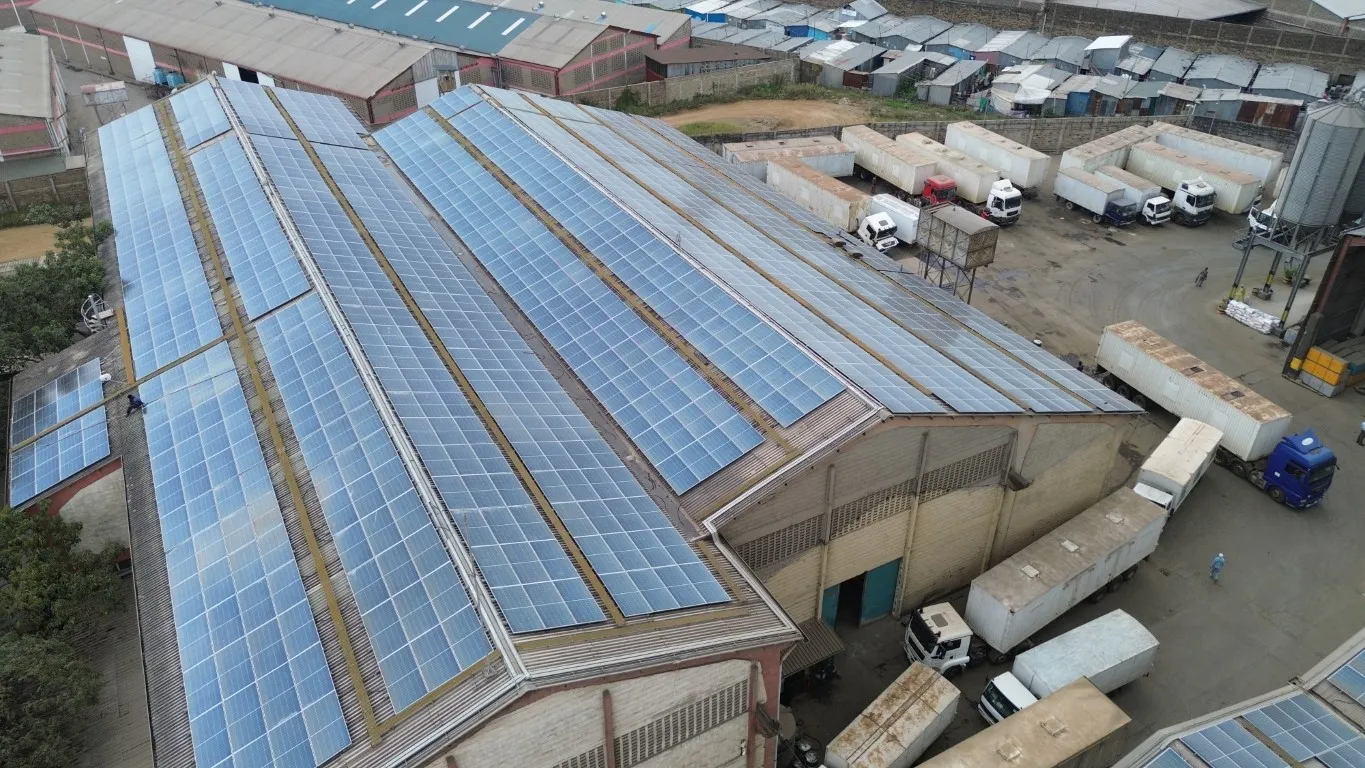
This project features a 1MWp roof-mounted solar power system installed for a leading food manufacturer in Nairobi, Kenya. The roof-mounted solar power system was carefully designed to uti...
Calculated from 1 MW of installed solar capacity × about 833 tCO2/MW/year, the rate implied by Spenomatic's published 2.4 MW Kenya tea project (2,000 ÷ 2.4). Actual savings depend on solar yield, displaced grid or generator power, curtailment and operating conditions; this is not an audited project result.
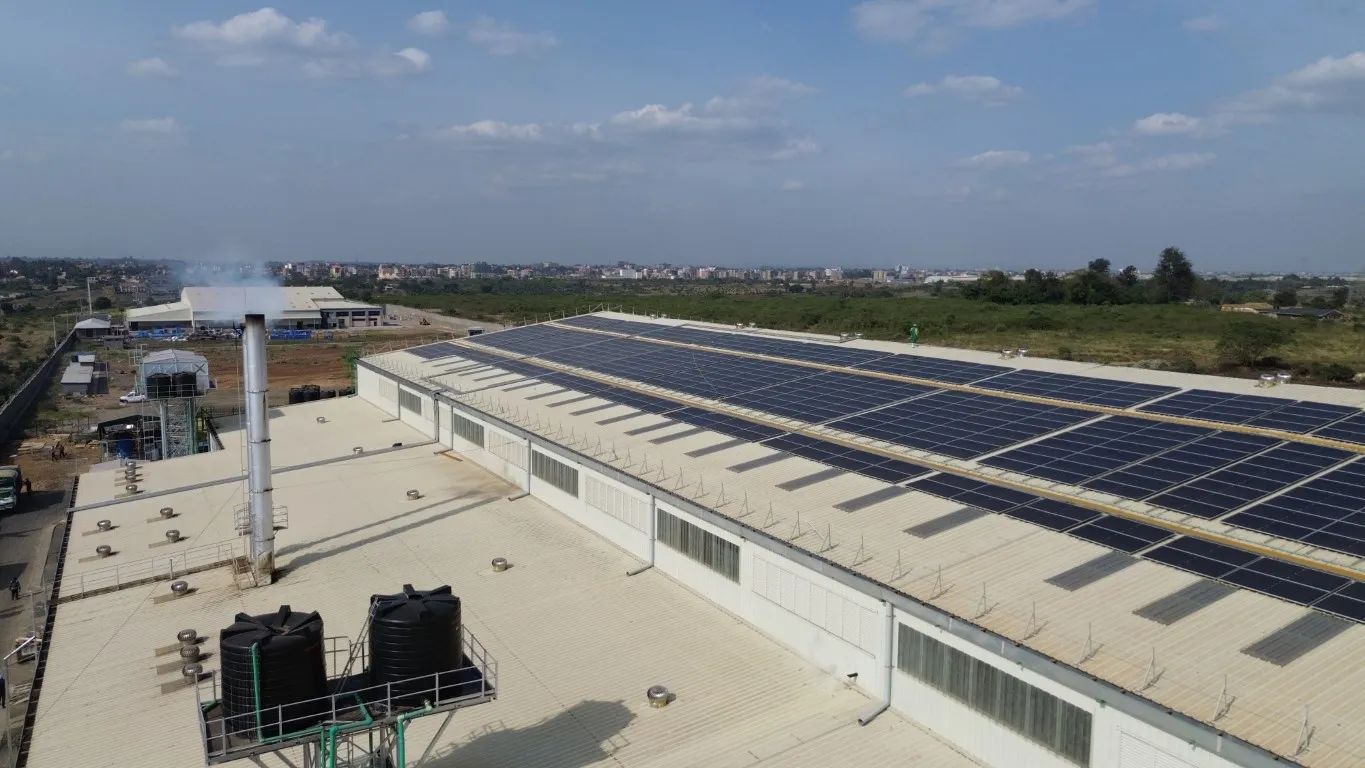
This project features a 700kWp solar power system for a food industry facility in Nairobi, Kenya. The installation is designed to make the best use of available space while delivering rel...
Calculated from 0.7 MW of installed solar capacity × about 833 tCO2/MW/year, the rate implied by Spenomatic's published 2.4 MW Kenya tea project (2,000 ÷ 2.4). Actual savings depend on solar yield, displaced grid or generator power, curtailment and operating conditions; this is not an audited project result.
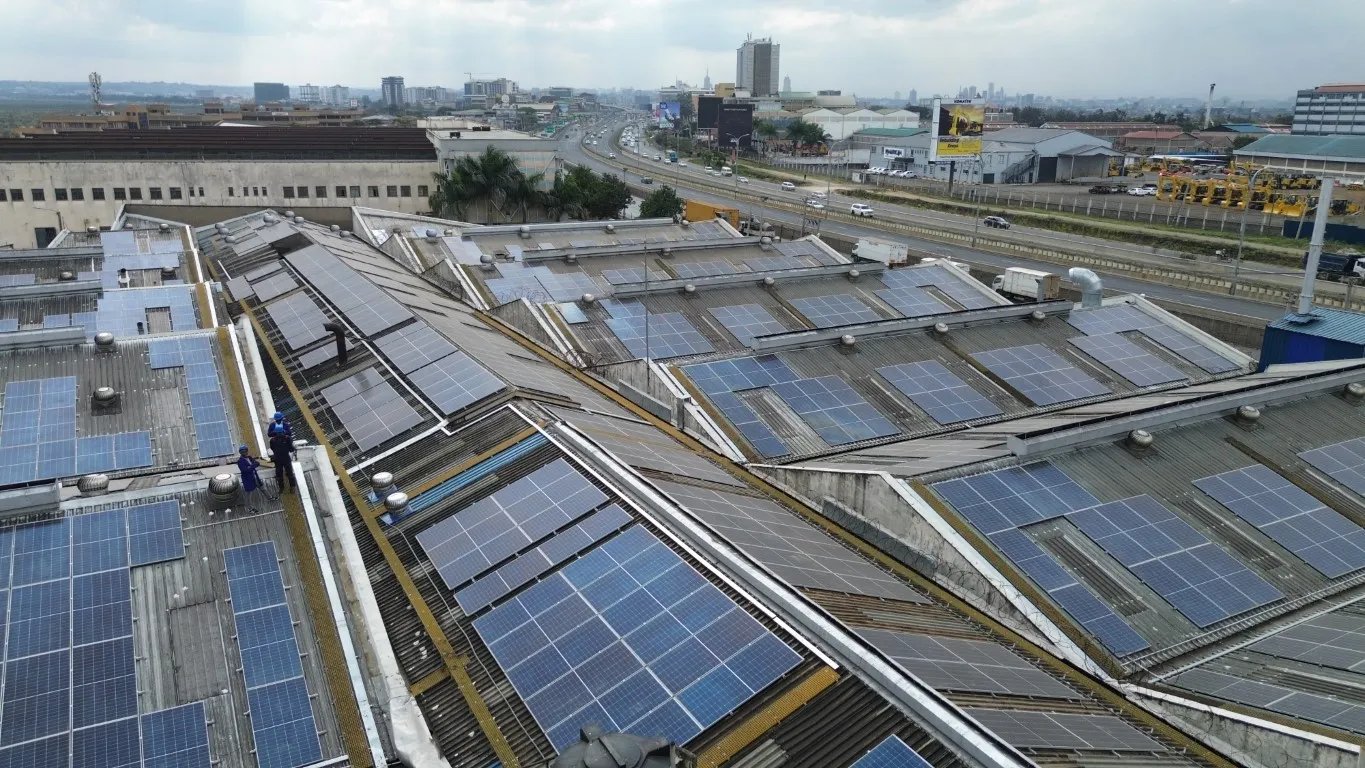
Industrial Solar Power Project – 625kWp Solar PV System in Nairobi, Kenya This project showcases a 625kWp solar PV system installed for a leading plastic manufacturing company in Nairobi,...
Calculated from 0.625 MW of installed solar capacity × about 833 tCO2/MW/year, the rate implied by Spenomatic's published 2.4 MW Kenya tea project (2,000 ÷ 2.4). Actual savings depend on solar yield, displaced grid or generator power, curtailment and operating conditions; this is not an audited project result.
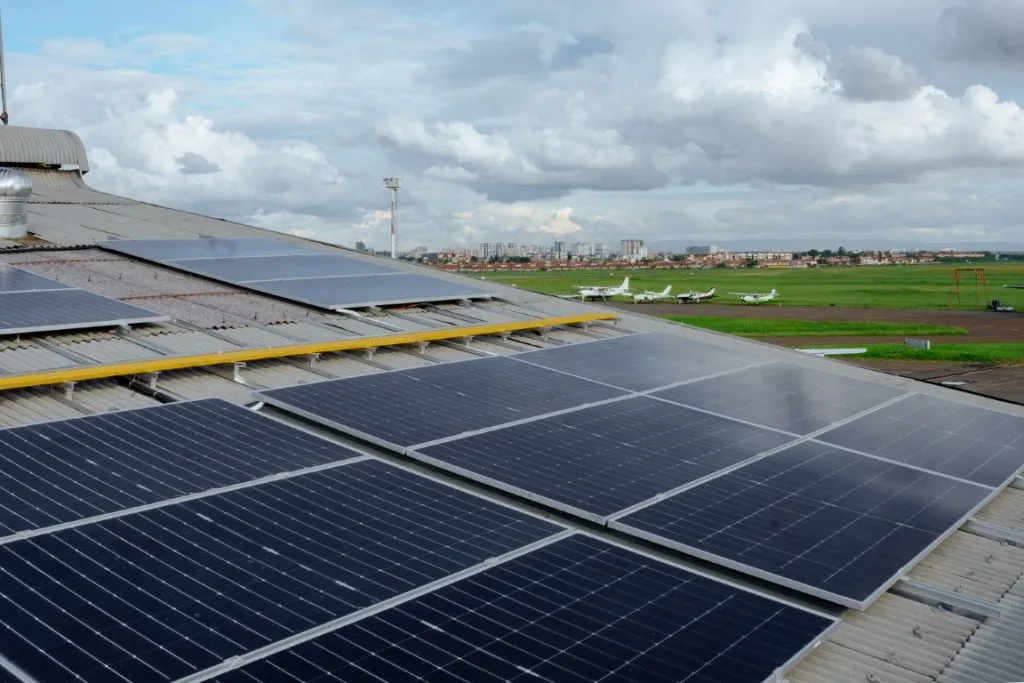
Commercial Solar PV Installation for Airline Hangar Operations At Spenomatic Solar Home Solutions, we go beyond installing solar panels. We engineer reliable, efficient solar energy solut...
Calculated from 0.027 MW of installed solar capacity × about 833 tCO2/MW/year, the rate implied by Spenomatic's published 2.4 MW Kenya tea project (2,000 ÷ 2.4). Actual savings depend on solar yield, displaced grid or generator power, curtailment and operating conditions; this is not an audited project result.
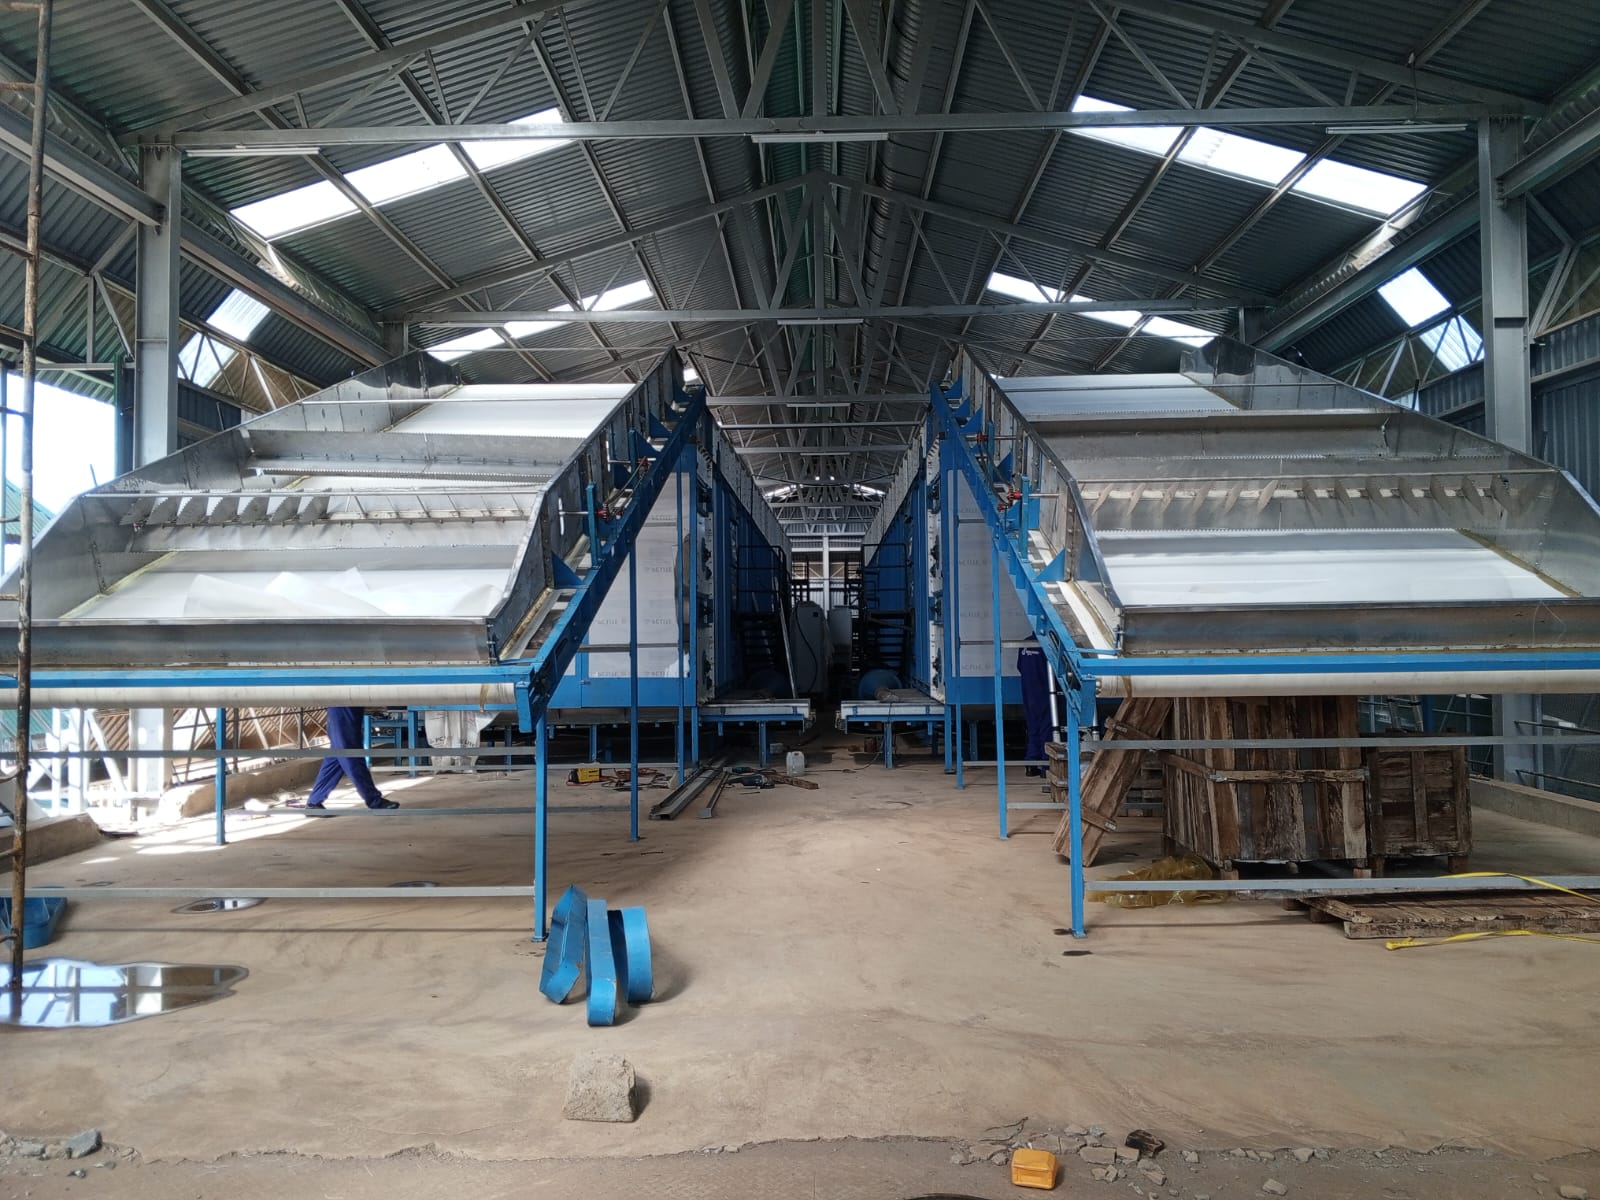
Precision Tea Processing Machinery for Enhanced Productivity At Spenomatic, we take pride in engineering efficiency for the tea industry by delivering advanced tea processing machinery th...
The available project information does not state an energy capacity or measured fuel or electricity displacement from which a defensible carbon estimate can be calculated.
Policy and environmental requirements change. These research notes strengthen early planning but do not replace project-specific legal, utility or environmental advice.
Spenomatic's Kenya projects help steel, food, milling, plastics, aviation, timber and tea-processing businesses replace part of their grid consumption with on-site renewable electricity. The 2.4 MW tea project reports more than 5 GWh of clean electricity and an estimated 2,000 tonnes of CO2 emissions avoided per year. Other solar project estimates on this page use the same project's implied benchmark of about 833 tCO2 per installed MW per year and are clearly labeled as indicative rather than audited results.
Evidence note: The published 2.4 MW Kenya tea project provides the carbon benchmark. Actual project savings depend on generation, the grid or generator power displaced, curtailment and operating conditions.
Spenomatic provides feasibility studies, engineering design, procurement, installation, commissioning, training and maintenance across commercial solar PV, boilers and biomass systems, steam systems, water and effluent treatment, tea machinery, laboratories and process chemicals.
Kenya has Energy (Net-Metering) Regulations, 2024 for eligible renewable self-generation. Connection capacity, approvals, metering and the commercial case must be confirmed with the relevant electricity licensee and EPRA for the specific site.
Yes. The verified projects on this page include solar installations for steel, tea, food, milling, plastics, aviation, rubber and timber operations, plus tea-processing machinery.
Coastal humidity and salt exposure, cooler highland temperatures, arid regions and distinct rainfall patterns can change corrosion protection, drainage, water storage, cooling loads and expected solar output. Spenomatic designs from site measurements rather than a single national assumption.
At concept stage. Kenyan projects that fall within the relevant schedules may require an EIA and NEMA licence before other development permissions or implementation. The final requirement should be confirmed with a registered environmental expert and the authority.
Share your site location, load profile, steam demand, source-water data or production challenge. Spenomatic will help identify the right feasibility path.